
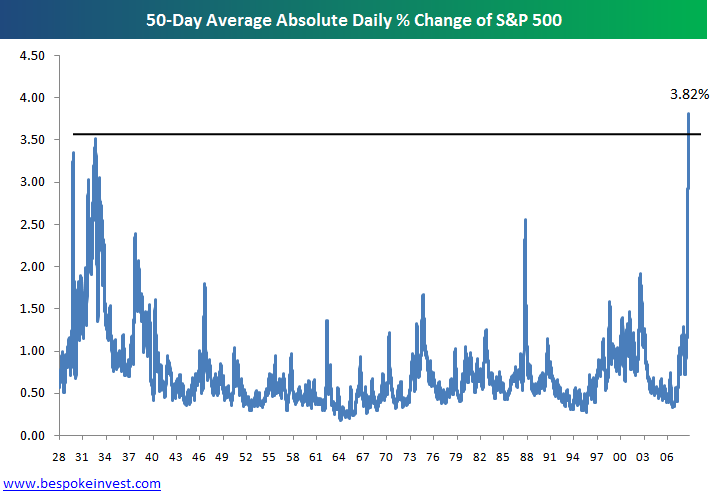
Two interesting graphics for today. The first represents the fact that we are now in the midst of the most volatile stock market EVER (in case you didn't know). Over the last 50 trading days, the average absolute daily percentage change of the S&P 500 has been 3.82%!!!!!
http://www.ritholtz.com/blog/wp-content/uploads/2008/11/vix-abs-change.png
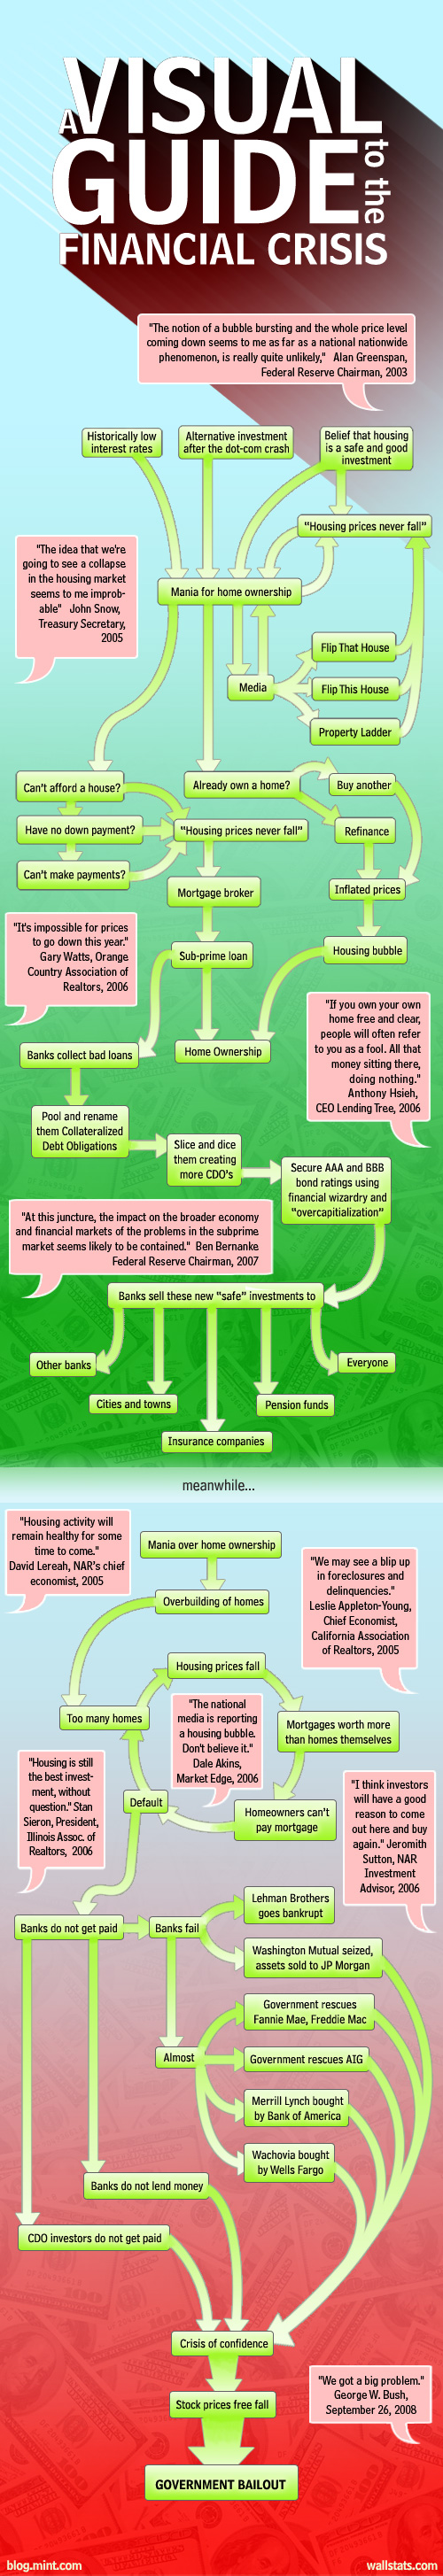
Here is an very appropriate look at how we got into this mess. Be sure to enlarge the image.
http://www.ritholtz.com/blog/wp-content/uploads/2008/11/visualguidecrisis2.jpg
11.26.2008
The Market
Posted by MC at 9:48 AM
Subscribe to:
Post Comments (Atom)
0 comments:
Post a Comment